I am planning to post quite a few things on computation and R. This is a basic post that demonstrates the capability.
- the
.Rmdfile is created as usual. It should be in/blog/_Rfolder - Run
_knitposts.Rfrom the main directory of the repository. The paths should be set accordingly so it knows where to take the.Rmdfile from and where to put the resulting.mdand picture files for rendering with Jekyll. - It should be good to go now.
library(MASS)
# here a comment
set.seed(0)
x <- rnorm(10)
y <- rnorm(10)
plot(x, y)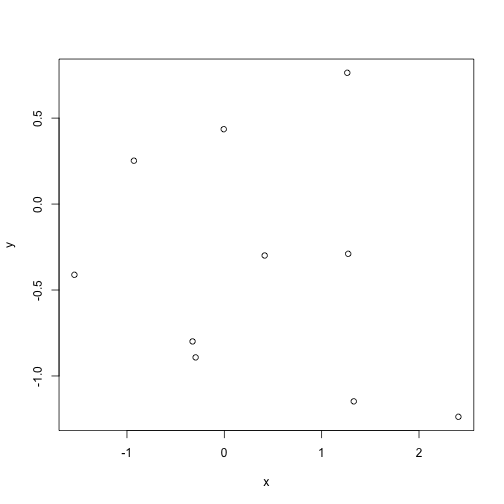
Here I am repeating code, but instead of liquid tag highlighting it with backticks.
library("MASS")
# here a comment
set.seed(0)
x <- rnorm(10)
y <- rnorm(10)
plot(x, y)